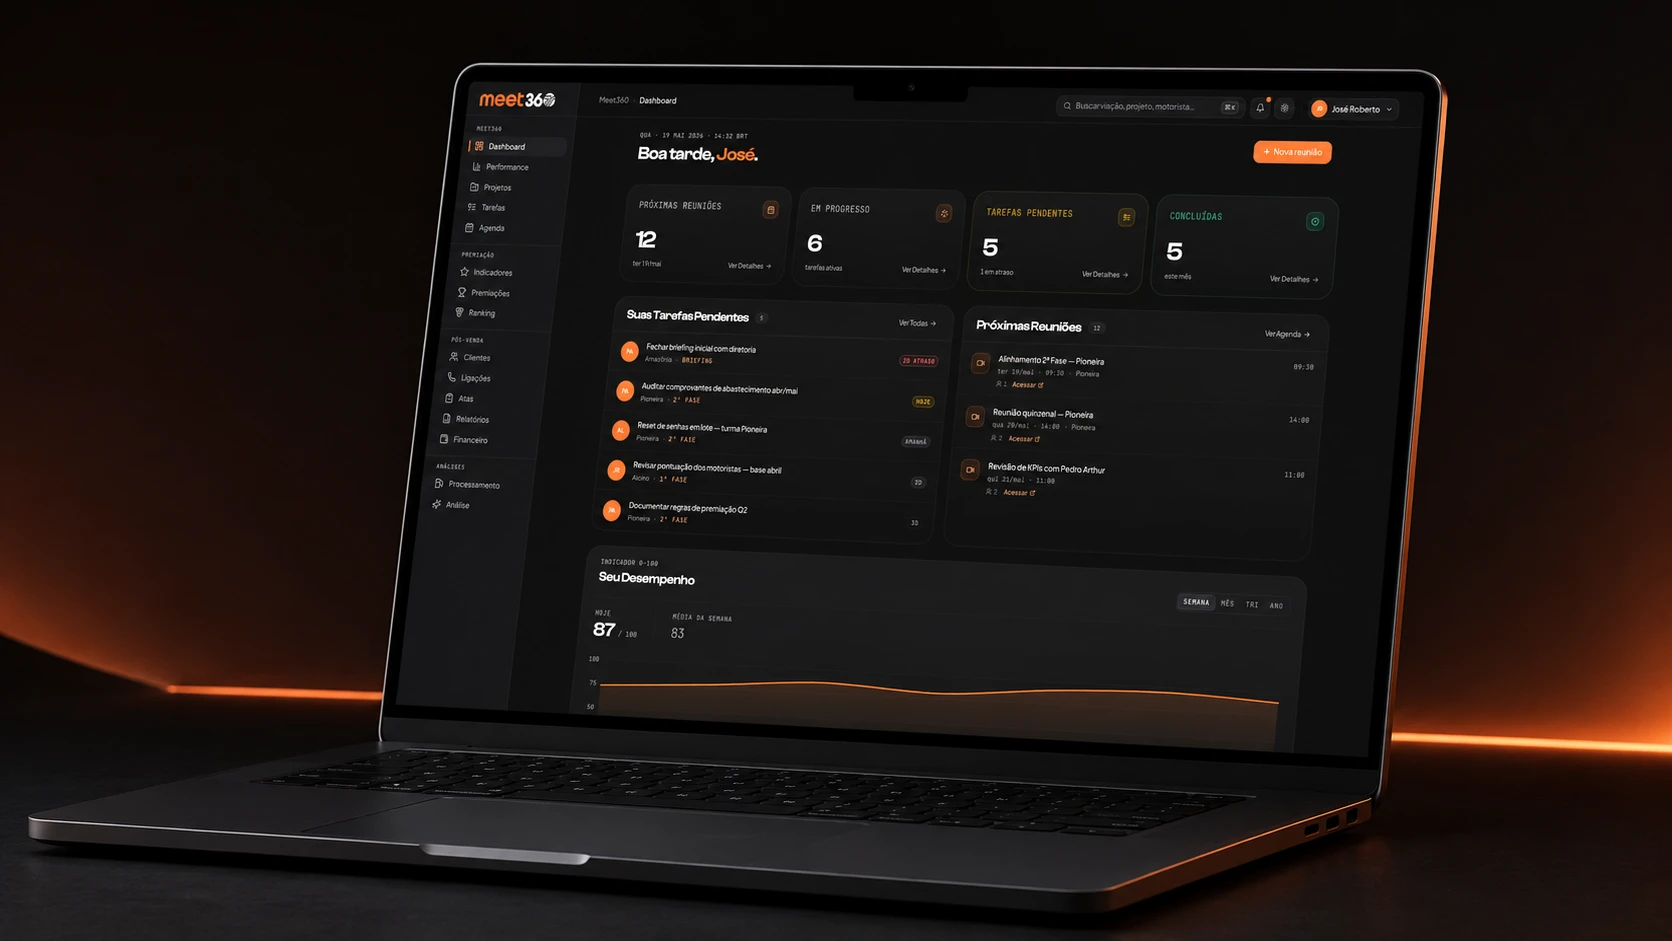
Meet360: Fleet consulting platform
An admin template that needed to become a product. From diagnosis to flow: screens in frames and decisions as proof. A premium product handed off to engineering.
- Design System
- Functional prototype
- WCAG AA
- AI in the flow
Meet360 is Track7's internal customer success system: fleet telemetry and onboard sensor data turned into management decisions. The front end ran on a raw Material UI template: confusing nav, lost hierarchy, ~20 inconsistent modals. Expensive data, hard to read.
The scope was not to patch. It was to replace the entire MUI front end with a premium product, navigable and ready for the dev to wire into the Postgres backend on AWS. Returning client, fixed scope end to end.
Managers open the dashboard
and know where to act.
Every screen answers a management question at a glance: how the fleet is doing, who needs attention, what to do today. Clear hierarchy, readable sensor data, a dark theme built for long reading without fatigue.
The ~20 inconsistent modals became 4 reusable patterns. The 4 overlapping dropdowns became one sidebar with logical groups.
All on a custom design system (tokens + 20+ components), shipped as a functional prototype (filters filter, CRUD changes state), ready for the dev to plug into the backend.
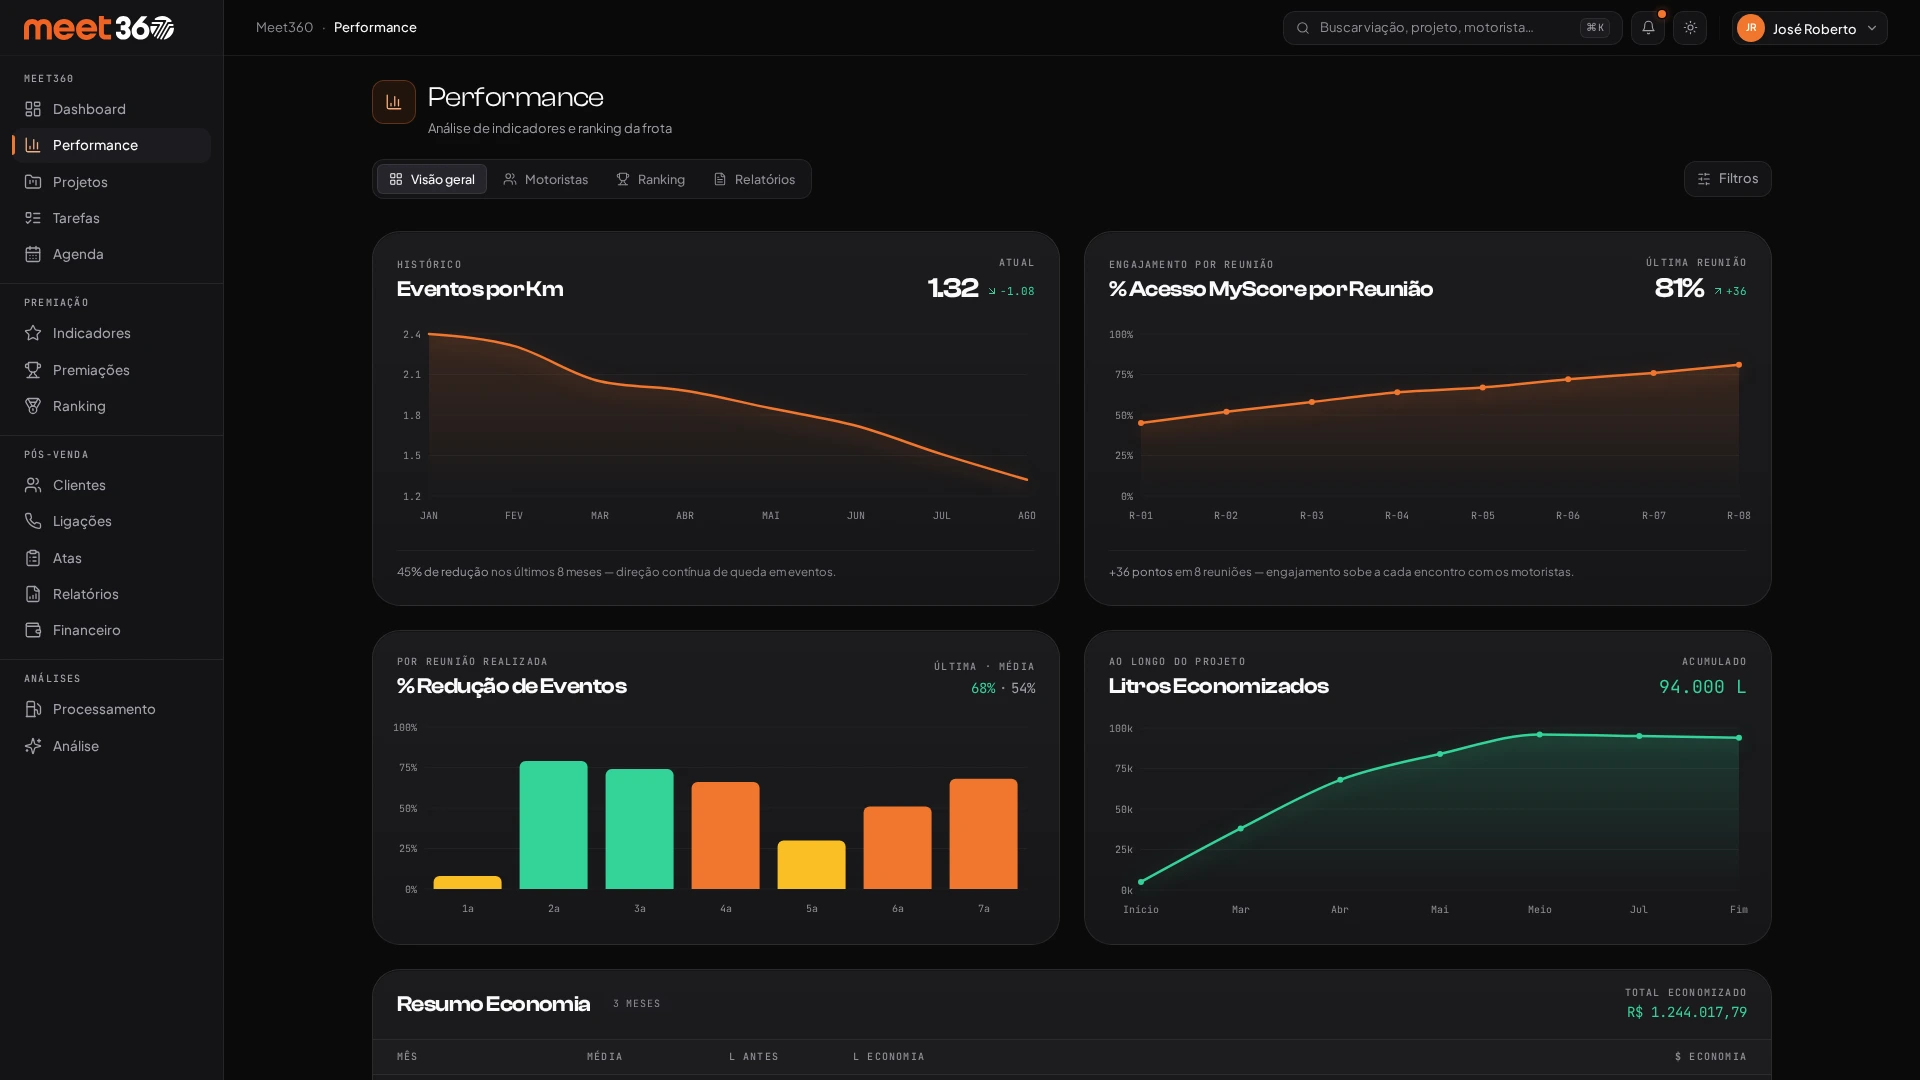
Each card leads with the number and the trend (events/km 1.32 ↘, engagement 81% ↗). The answer comes before the chart: the manager reads the fleet's direction at a glance, the curve only confirms it.
Same data,
a different read.
The template stacked everything at the same weight, in a generic light theme. In the redesign, what matters rises to the top and the data becomes legible.
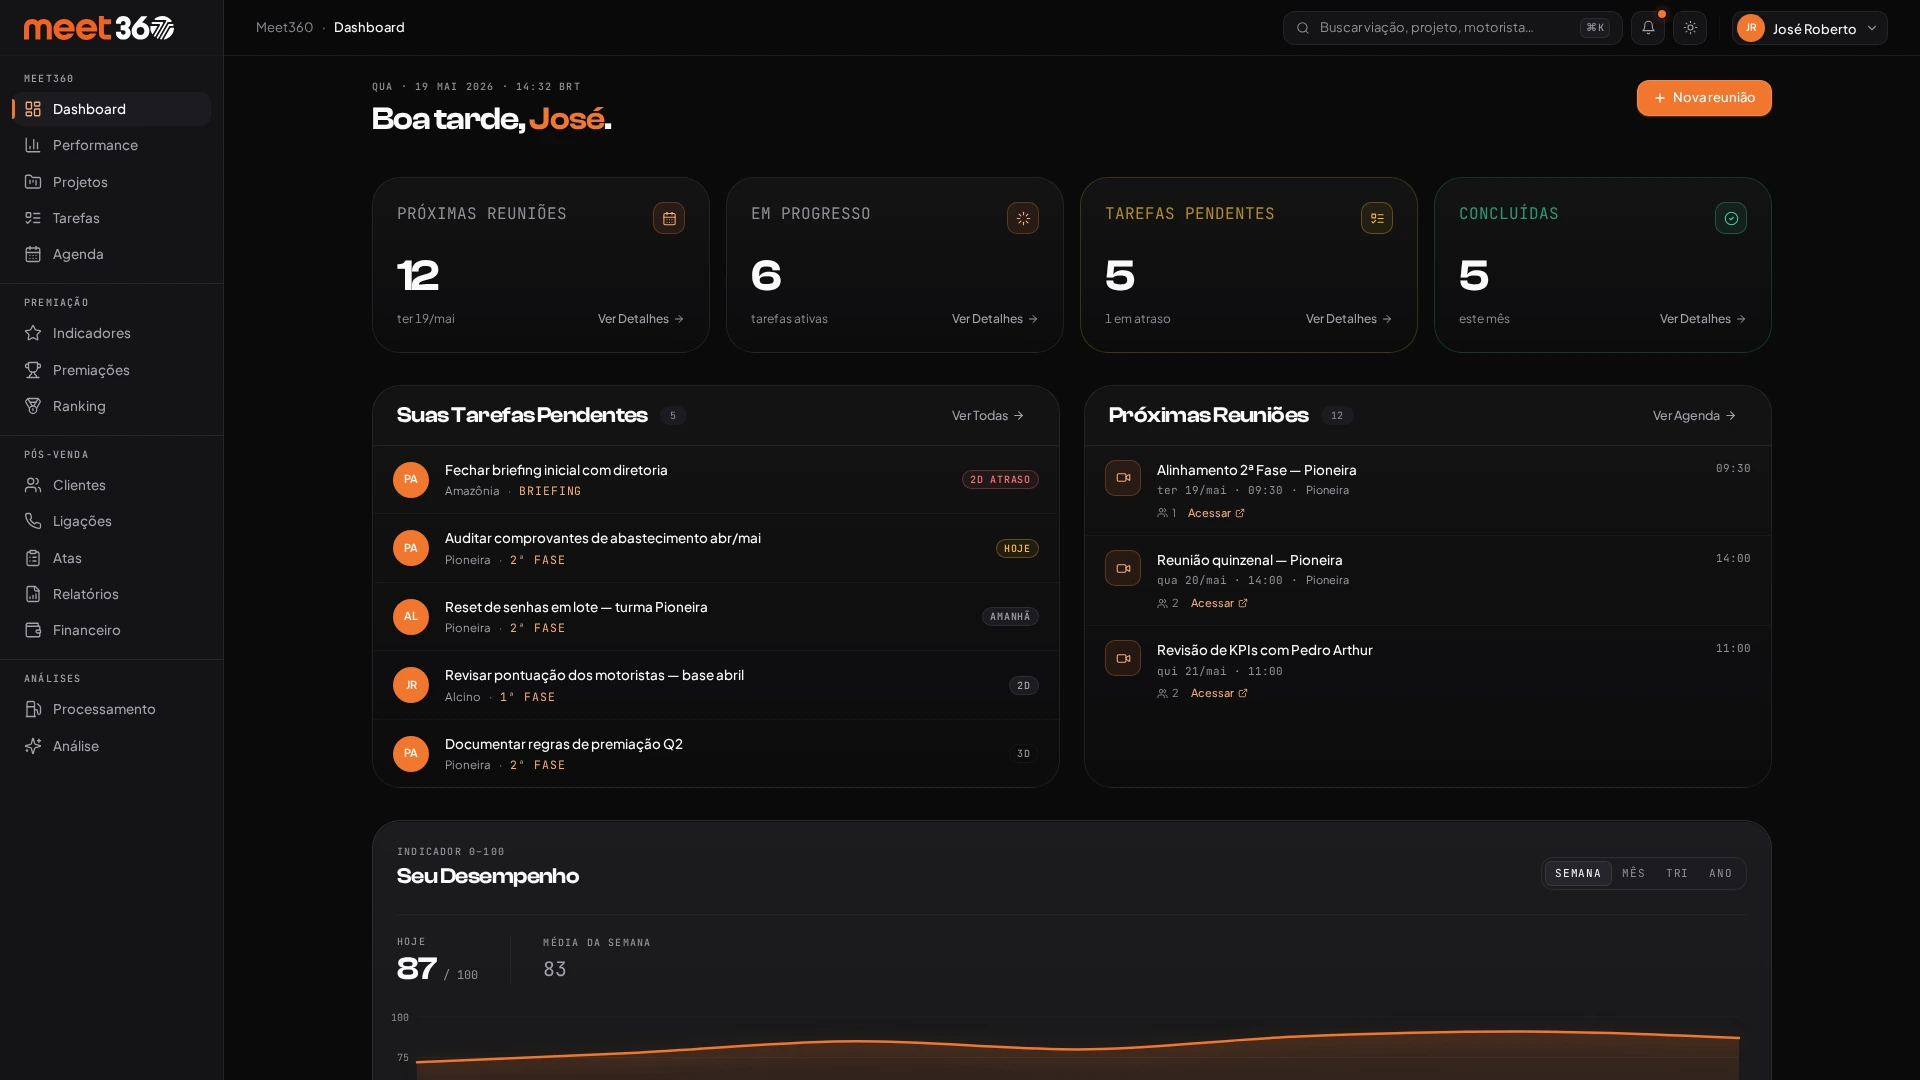
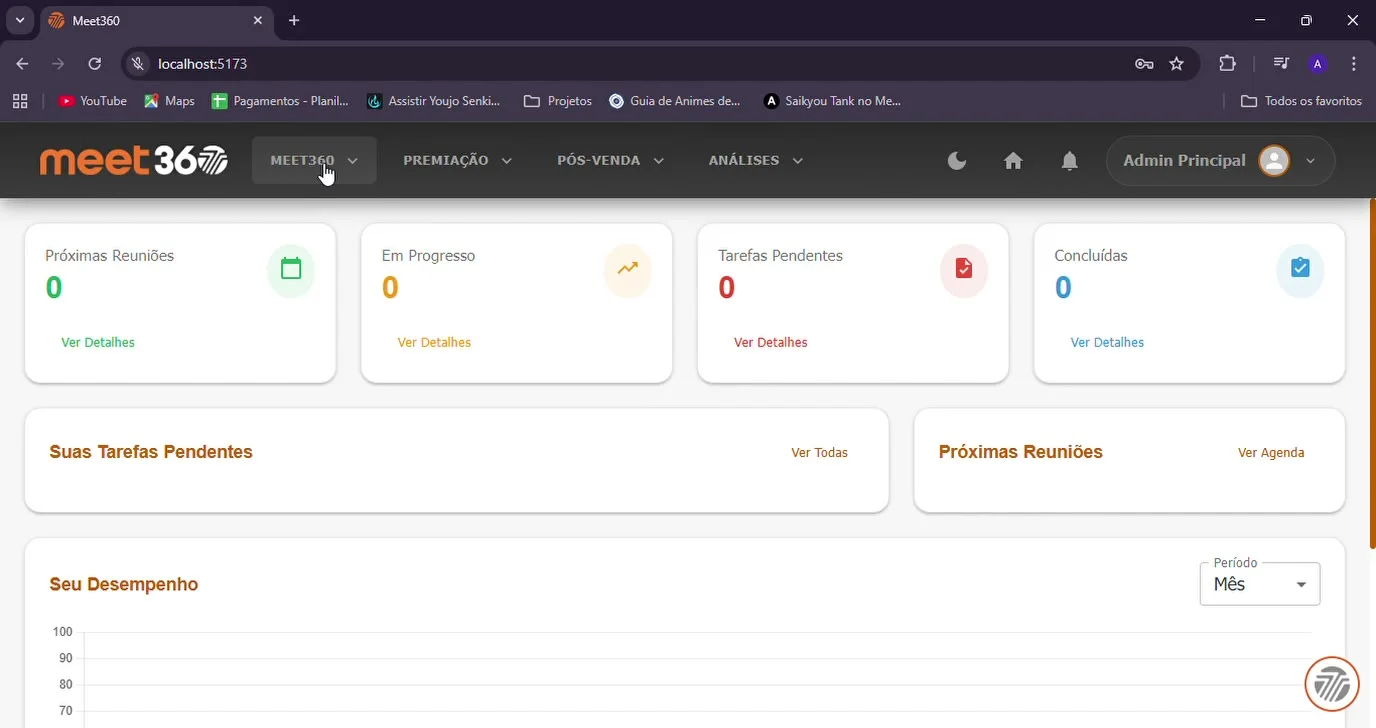
Before, a flat list in a light theme, everything at the same weight. After, the management numbers rise as cards up top and the dark theme carries long reading sessions.
From diagnosis to
handoff, in four steps.
Double diamond adapted to the timeline: discover what hurts, define the patterns, develop the system, ship it ready for the dev.
Diagnosis across 6 layers
UX audit on the client's product: flow, navigation, density, states, consistency, accessibility.
Inventory and standardization
I mapped the whole product and merged what overlapped.
Design system + functional prototype
The interface navigates end to end, with real state.
Audit and handoff
Delivered ready to plug into the Postgres/AWS backend, no guessing on data shape.
Seven screens,
one system.
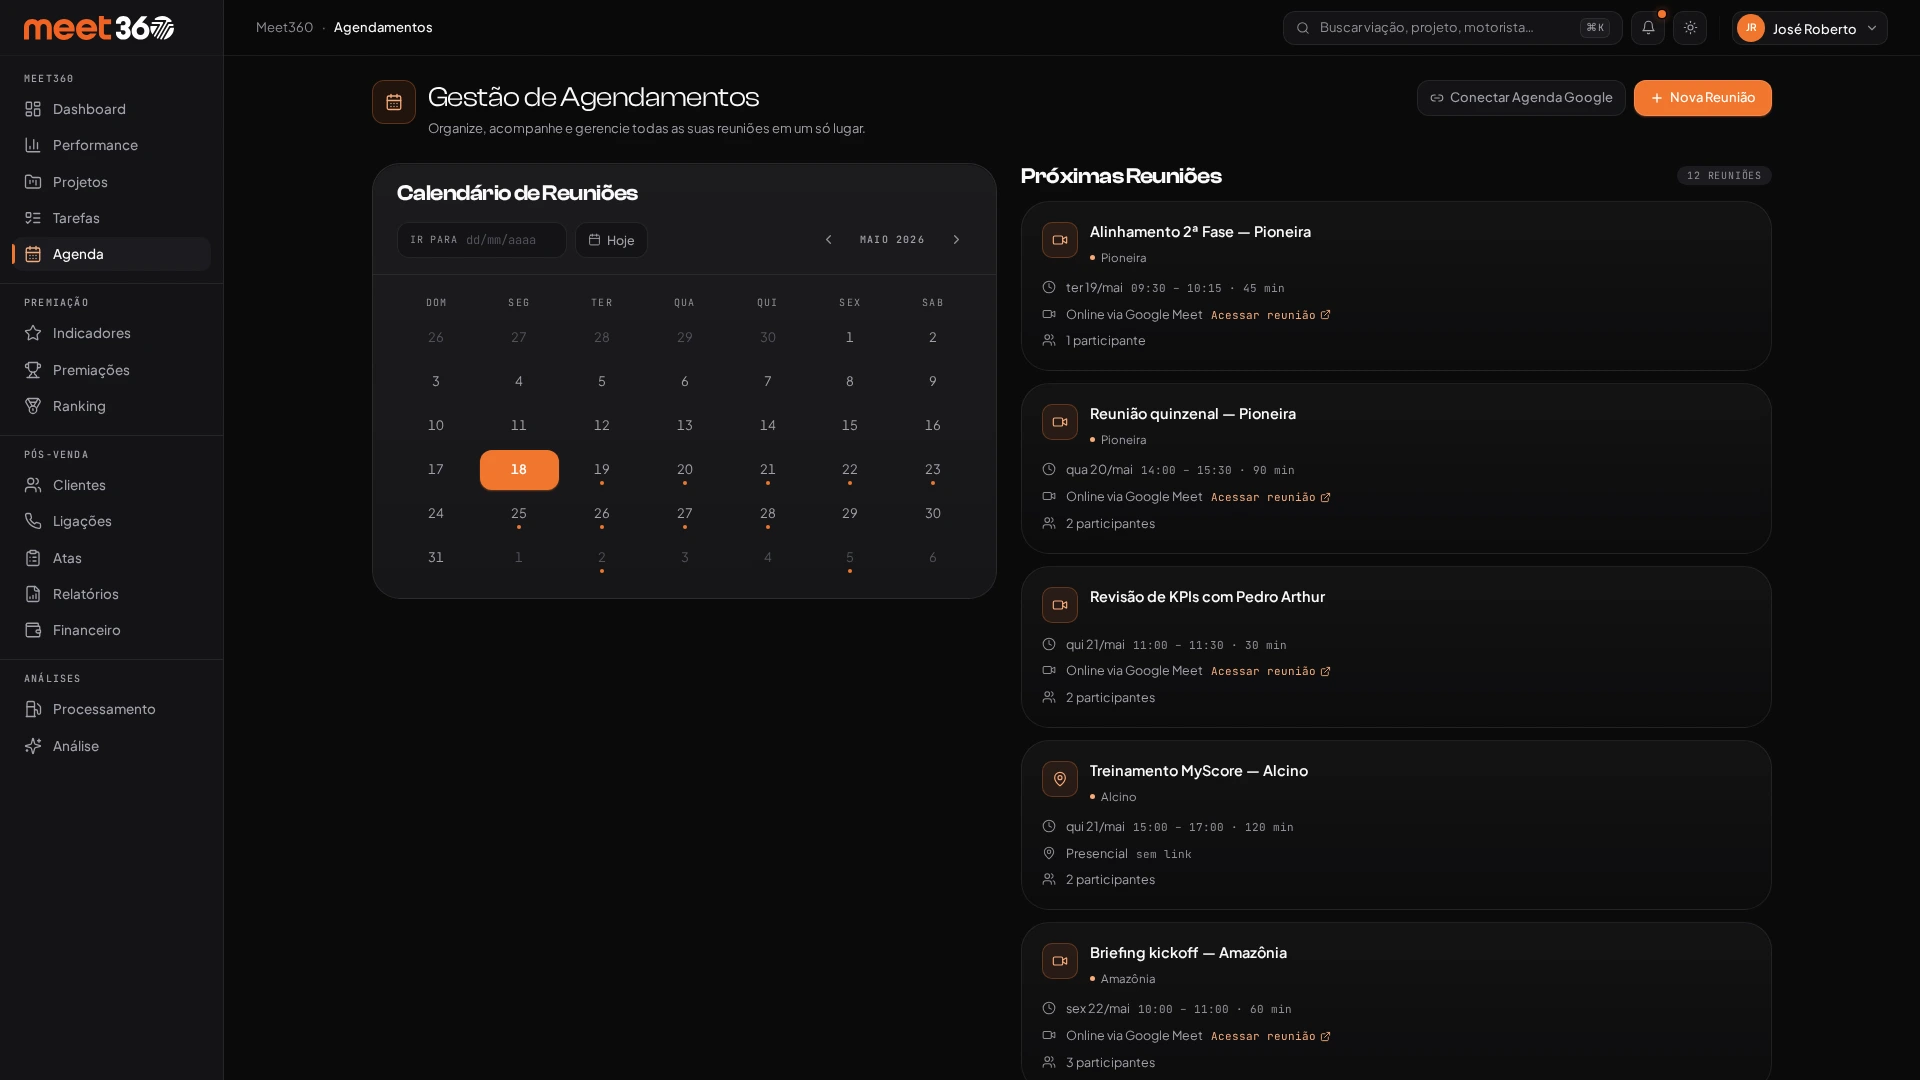
Login, dashboard, performance, projects, detail, tasks and calendar, all on the same visual system.
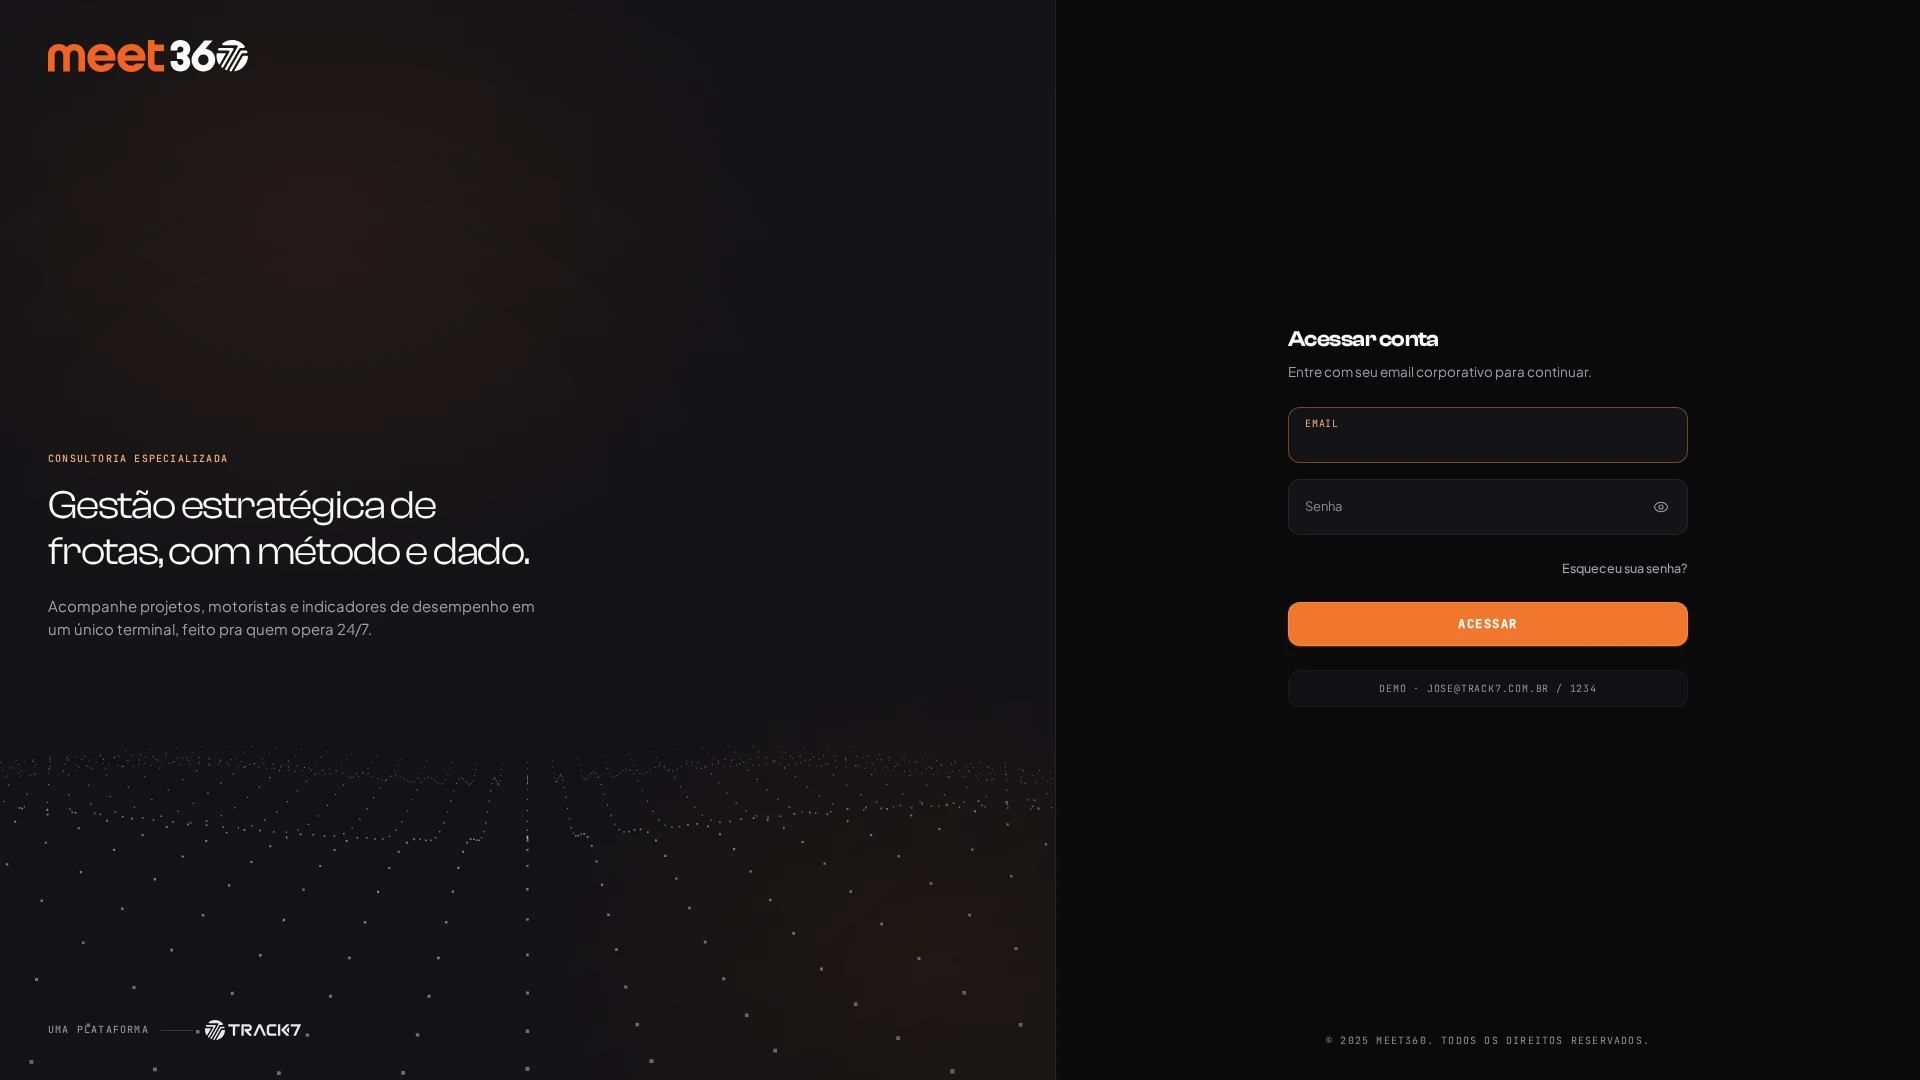
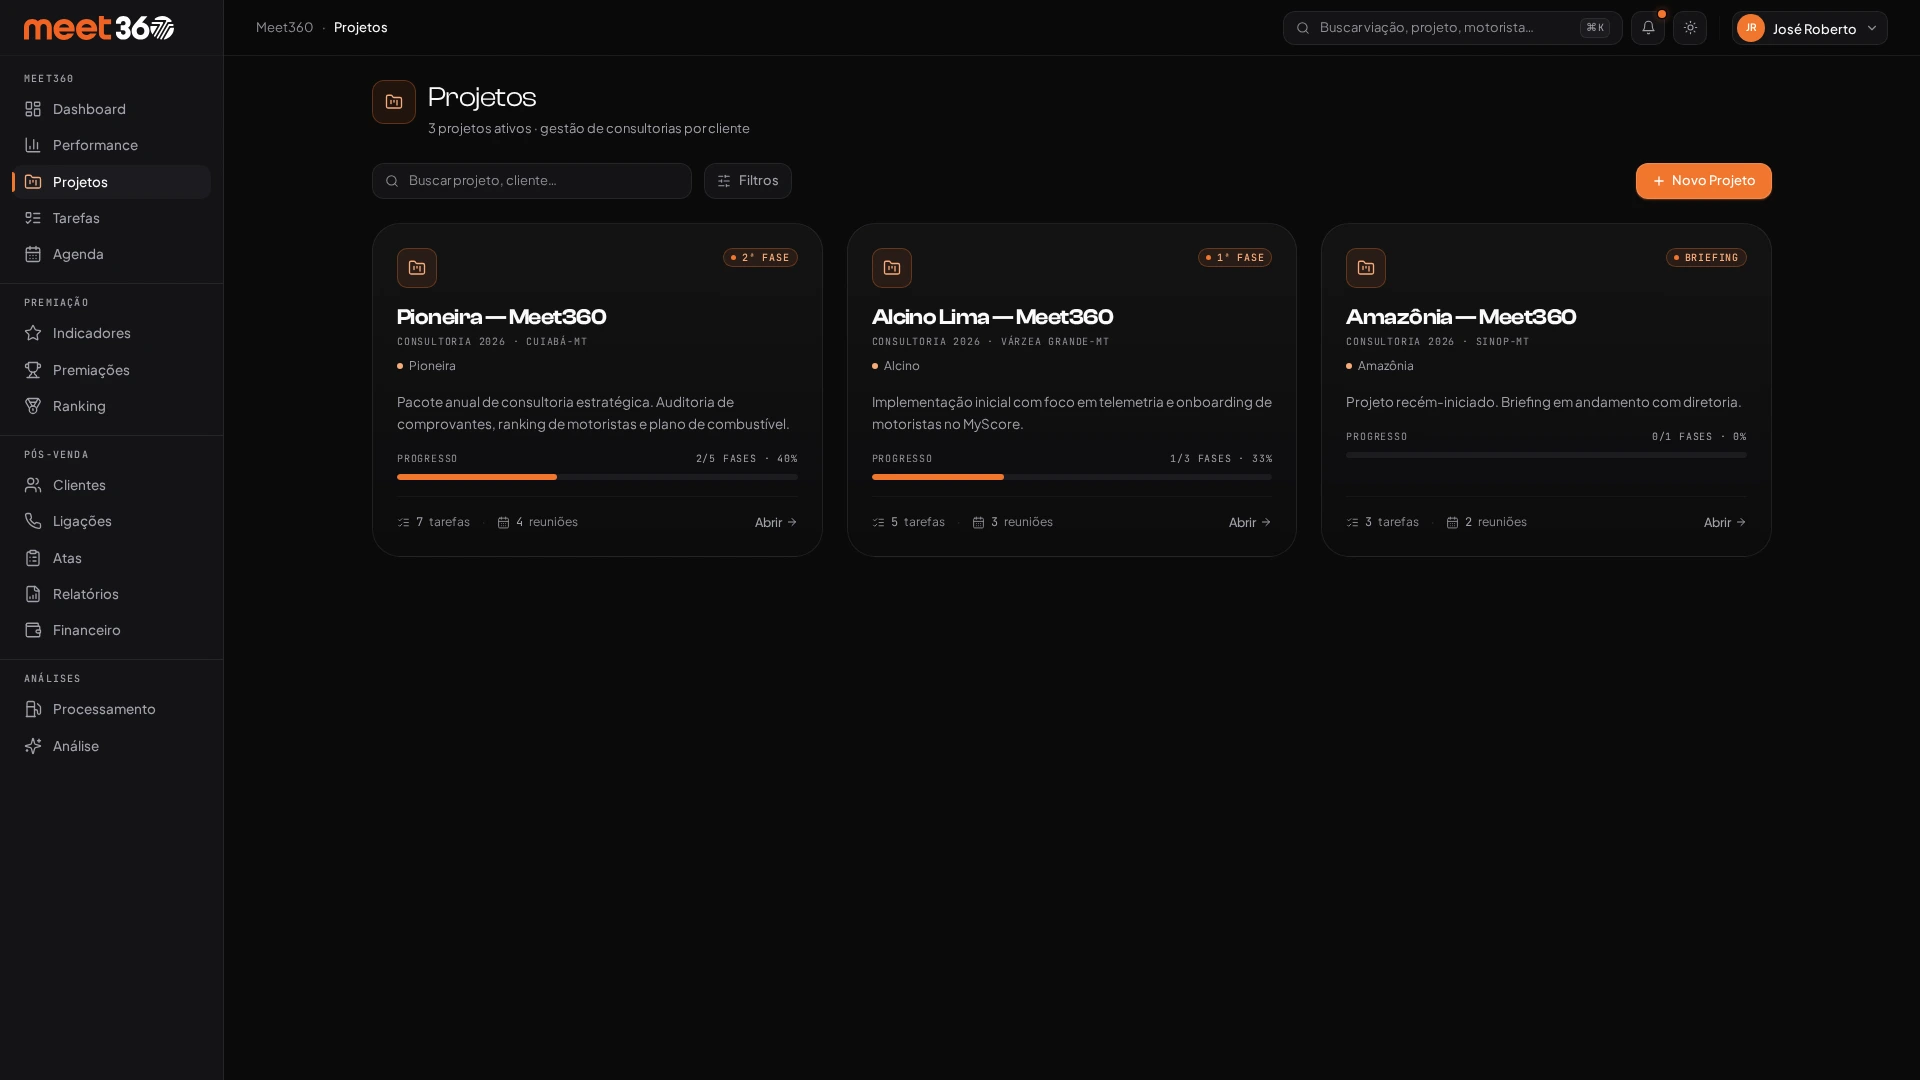
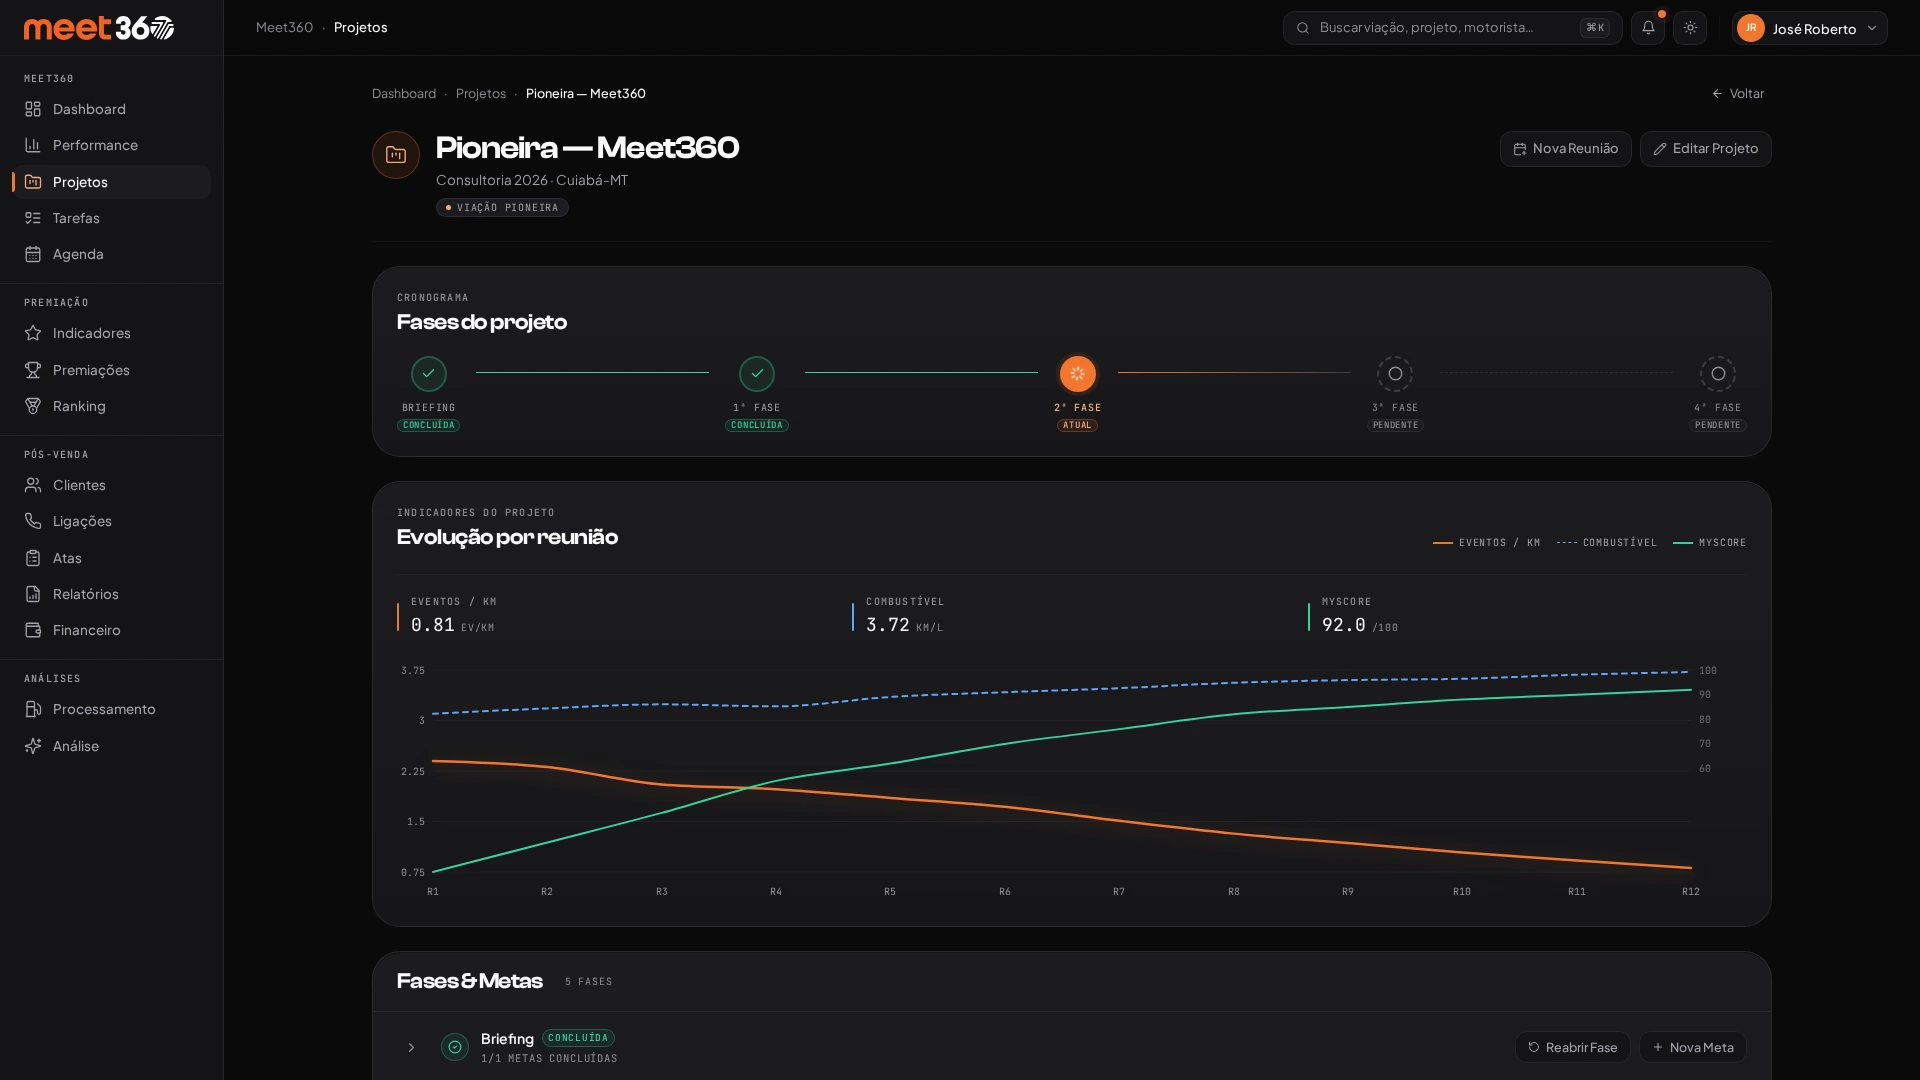
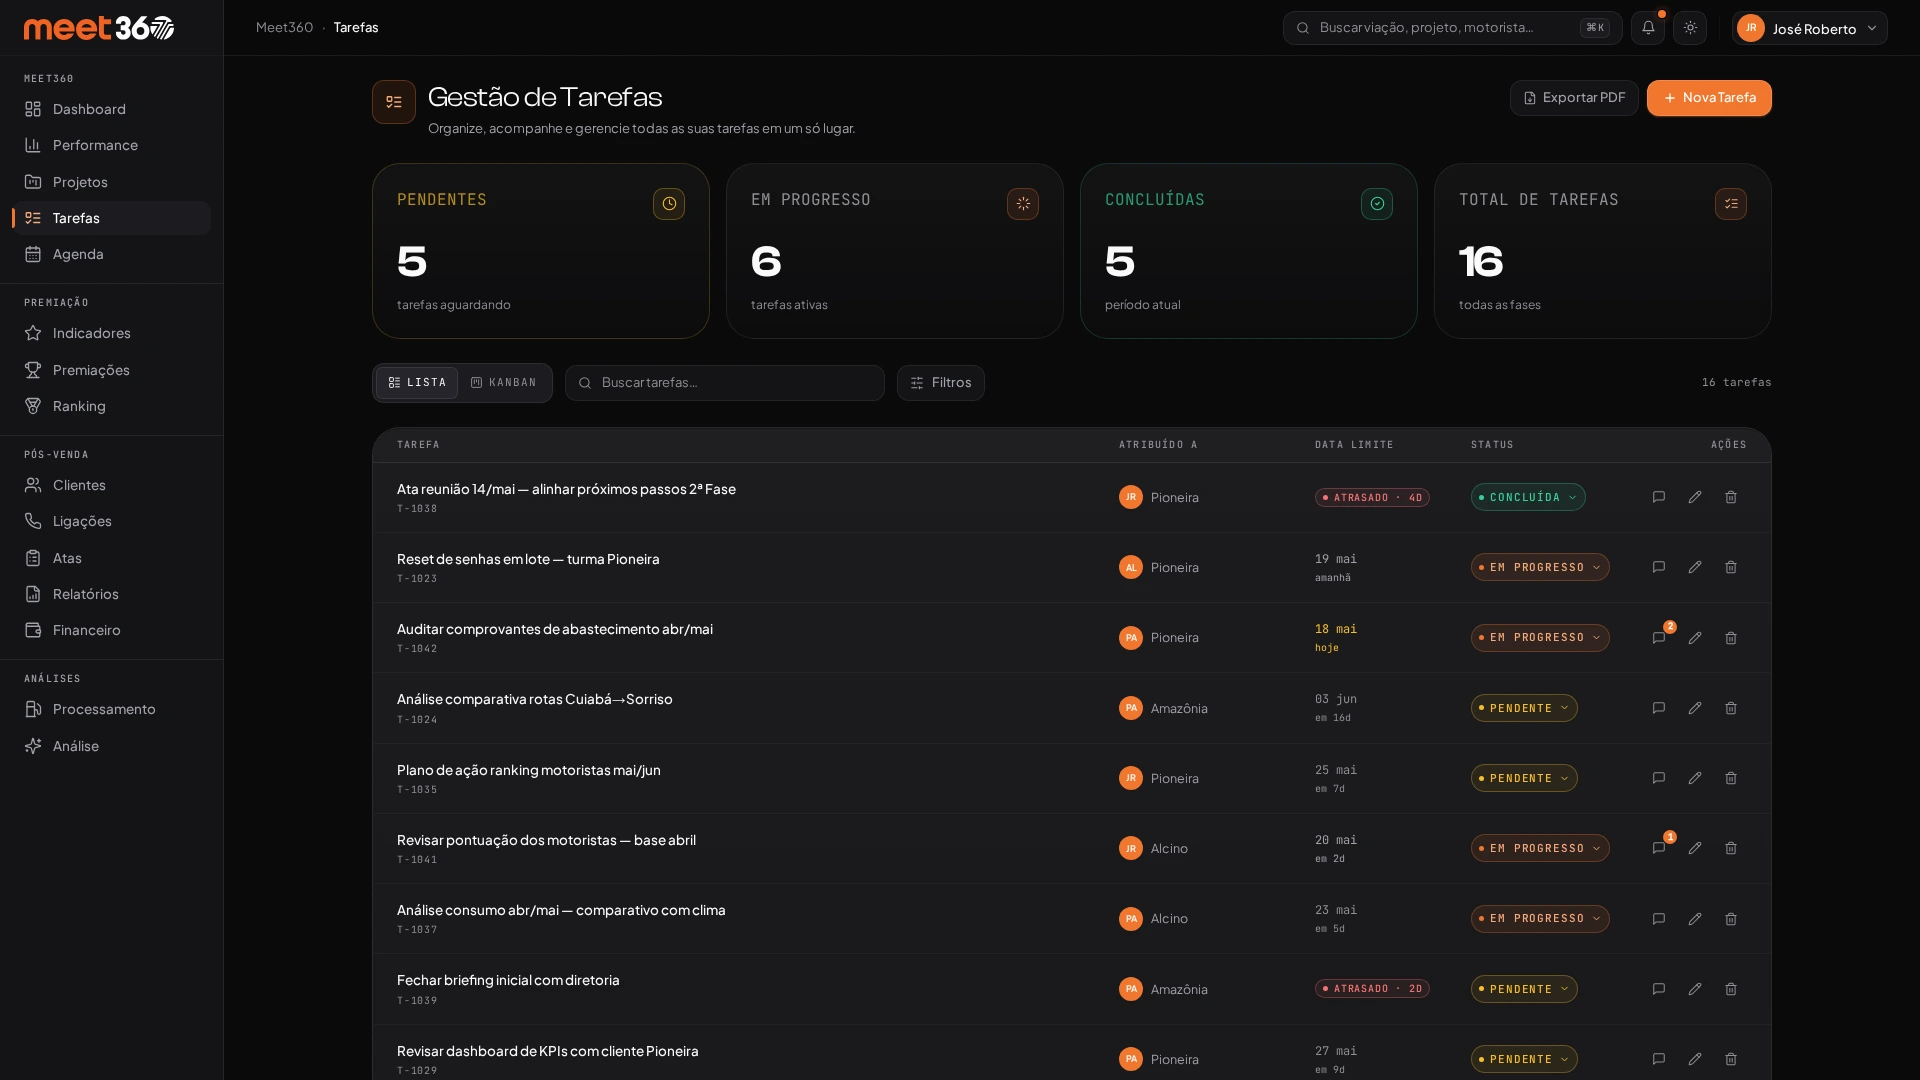
Ready for the dev to plug in.
Data contract in TypeScript and documented handoff. Performance and accessibility measured (Lighthouse and WCAG).
The prototype
is live.
Navigable end to end, with sample data: the filters filter and the records change state.
AI in the pipeline, decisions with me
Every screen and the design system were built by me directing Claude Code. UX in command, AI on execution. That is how I shipped the whole product, end to end.
Heuristic diagnosis from the client's product, not interviews with end users. Validation was technical (WCAG and Lighthouse), not usability testing with participants. The prototype is functional client-side with mock data, delivered for the dev to integrate with the real backend.